Services
We build on open-source observability tools (Grafana, Loki, Tempo, Mimir, Prometheus and OpenTelemetry) and AWS, as an alternative to expensive commercial platforms. We also help teams use AI on their observability stack, and monitor the AI applications they run.
Observability Audit
Entry offer5 to 14 days, fixed price
Where your monitoring bill actually goes
A fixed-price audit of your observability stack. 5 to 14 days, no retainer. You get a ranked, costed list of what to cut and a plan to cut it. The report is yours to act on, with or without us.
Starter
EUR 900
5 days
- Ingest and spend inventory
- Top cost drivers, ranked
- Written report
Standard
EUR 2,000
7 days
- Everything in Starter
- Signal quality review
- Remediation plan with effort estimates
- Walkthrough call
Advanced
EUR 4,500
14 days
- Everything in Standard
- Target-stack architecture and sizing
- Terraform and Helm code for the target stack
Who it is for
- Engineering leads and CTOs whose monitoring costs keep rising
- Teams with noisy alerts that nobody trusts
- Teams that run production systems without enough monitoring
What is included
- Ingest inventory: every metric series, log stream and trace, with its volume and what it costs you
- Cost drivers, ranked: what to cut first, in order, with an estimated saving next to each line
- Signal quality review: dashboards nobody opens, alerts nobody acts on, and gaps that hurt during an incident
- Remediation plan: prioritised work with effort estimates, sized so you can staff it or hand it back to us
- Optionally, an AI readiness check (which of your alerts have runbooks, and what an AI agent could safely read)
Deliverables
- A written report with findings ranked by impact
- A walkthrough call with your engineers
- A plan for the open-source stack we would use (Grafana, Loki, Tempo, Mimir, Prometheus, OpenTelemetry) on AWS, where it fits
How it starts
Send us a request. We reply, agree the tier, the scope and the access we need, and the work starts on a date we set together.
Request an Observability AuditObservability Implementation
We work directly with your engineers and hand over a stack your team can operate.
Who it is for
- Teams that want metrics, logs and traces in one place on open-source tools
- Teams that want to move away from expensive commercial observability platforms
What is included
- Setup of Grafana, Loki, Tempo, Mimir and Prometheus on AWS
- Instrumentation with OpenTelemetry
- Dashboards and alerting built around your services
- Infrastructure defined as code, so the stack can be rebuilt and reviewed
Deliverables
- A running observability stack in your AWS accounts
- Dashboards and alert rules for your services
- Documentation your team can use to run and change it
How it starts
We usually start from the findings of an Observability Audit. If you have not done one, we begin with a short scoping call.
How it relates to the audit
The audit report becomes the scope of this work. We implement the fixes in the order the audit ranks them.
Start with this serviceAI for observability
Engineers lose time at the start of an incident: which dashboard, which query, which runbook. We connect an agent to your Grafana stack through MCP, so your team can ask in plain English and get the query and the answer.
Can the agent change anything?
No. Access is read-only by default, limited to the data you choose, and every query is logged. We write the access rules down with you before anything is connected.
Alerts that explain the fix
When an alert carries its runbook, the agent can say what the alert means and what to do next, instead of leaving your on-call engineer to search for it. We add the runbook context to your alert rules and keep it next to the rules in your repository.
Our own proof of concept
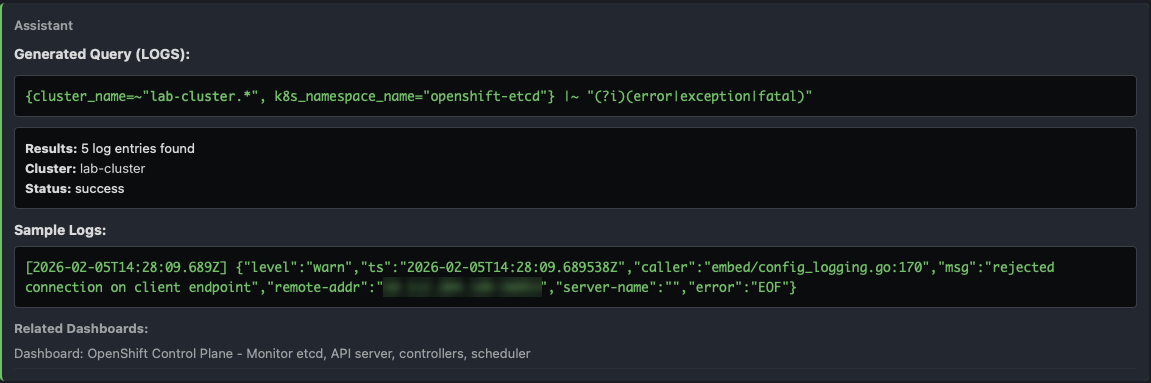
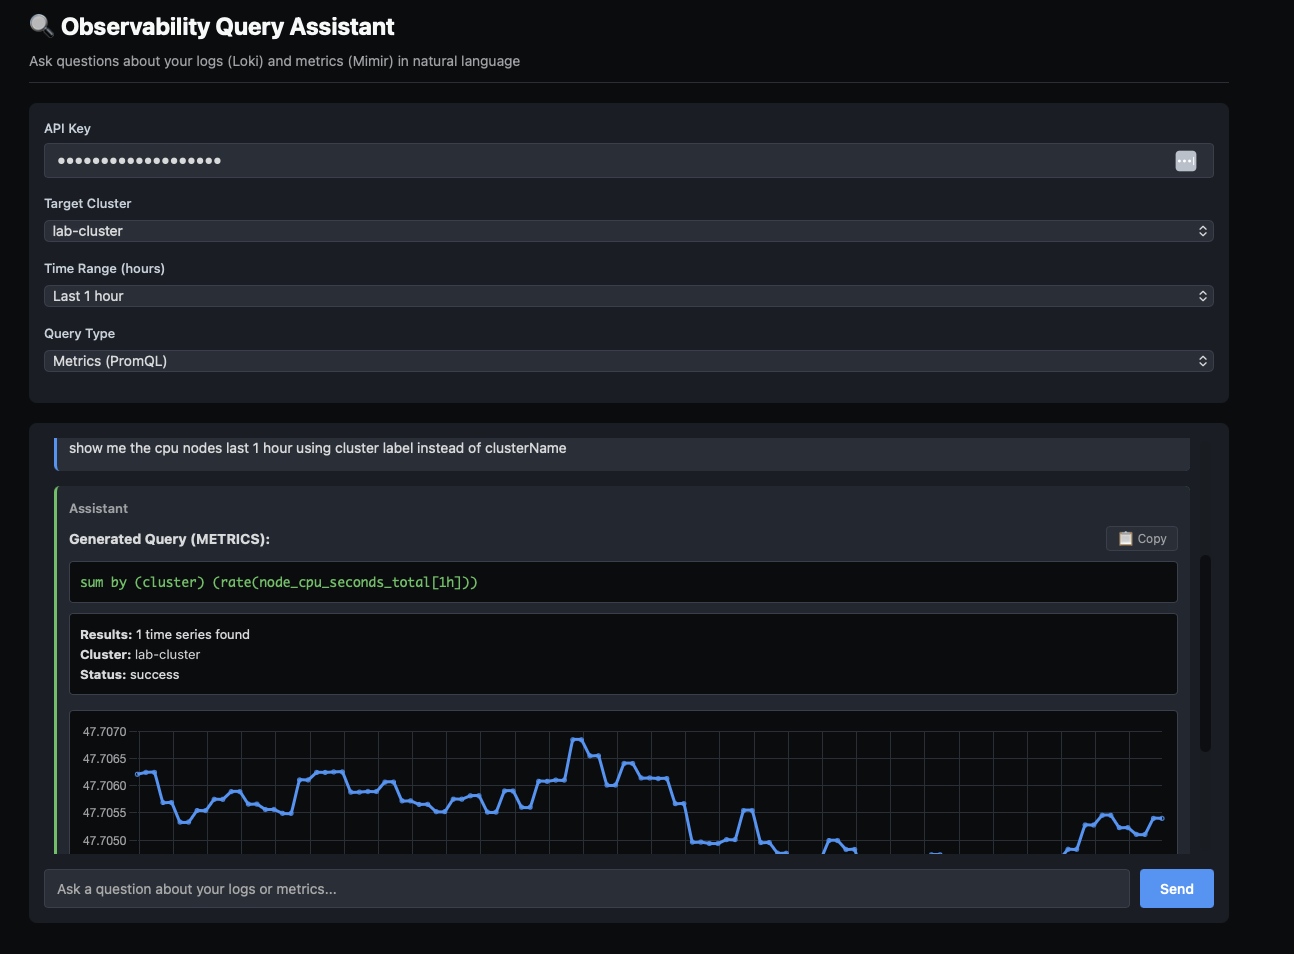
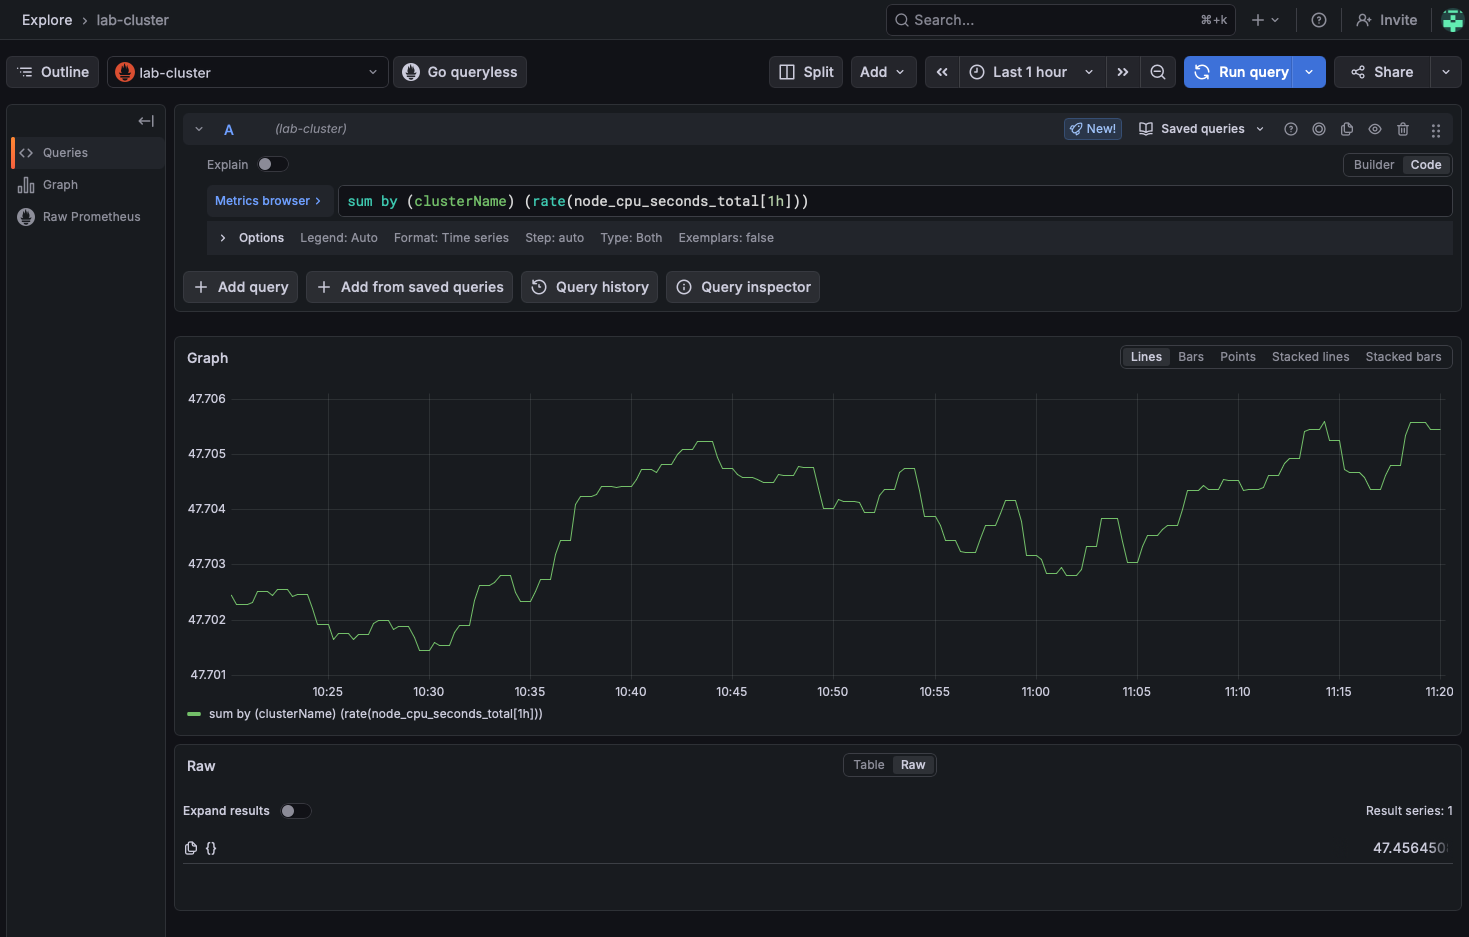
We built this on our own stack first. The MCP server connects to the LGTM stack, engineers ask questions in English, and alerts carry runbook context so the agent explains how to resolve the issue. It is our own proof of concept, not client work, and the screenshots below show a real session on our own stack.
Who it is for
- Platform and engineering leads who already run Grafana and want faster answers during incidents
- Teams whose on-call engineers lose time finding the right query, dashboard or runbook
- Teams that want AI help on their telemetry without giving an agent write access to production
What is included
- Setup of an MCP server for your LGTM stack (Grafana, Loki, Tempo, Mimir and Prometheus), using Grafana's own MCP server, custom MCP tools, or both
- Read-only, scoped and audited access, so an agent sees only what you allow and every query is logged
- Plain-English investigation of metrics, logs and traces, so your engineers can ask what changed and get the query and the answer
- Alert enrichment with runbooks, so an agent can explain how to fix the issue the alert describes
- AI-assisted analysis of telemetry volume and cost, looking at unused metrics, high-cardinality labels and noisy log streams, with proposed reduction rules for you to review
Deliverables
- A running MCP server connected to your observability stack, with its access rules documented
- Alert rules that carry runbook context
- A written list of proposed telemetry reductions, each with the rule to apply and what it affects
- A handover session with your engineers
How it starts
We start with the Observability Audit, which can include an AI readiness check. If you already run Grafana, a short scoping call is enough to agree what the agent may read.
How it relates to the audit
The audit shows which alerts have runbooks and what an agent could safely read. That sets the scope of this work, and its cost findings feed the telemetry reduction rules.
Start with this serviceObservability for AI
An LLM application can fail without an error: the answer is wrong, slower or more expensive than last week, and nothing alerts. We make those changes visible, on the same open-source stack we use for the rest of your systems.
What we measure
Each request is a trace: the prompt, the retrieval step, the model call and any tool calls. From the traces we build the numbers your team asks about: tokens, cost per request, latency, errors and evaluation scores. Tools such as LangSmith and Langfuse exist for this too. We can work alongside them or replace them with open-source tools in your own account, depending on what you already use.
RAG and answer quality
If your application retrieves documents before answering, we look at that step as well: what was retrieved, whether it was relevant, and how the final answer scores against the baseline. We can also build or improve the retrieval itself over your runbooks, incidents and product knowledge.
Who it is for
- CTOs and product teams with an LLM feature in production and rising cost per request
- Teams that get complaints about wrong answers and cannot see why
- Teams that run a RAG pipeline or agents and have no view of retrieval and tool steps
What is included
- Tracing of LLM calls, retrieval and agent steps with OpenTelemetry, into the Grafana stack
- Dashboards for tokens, cost per request, latency and errors
- Evaluation scores tracked against a baseline, so a drop in answer quality shows up as a line crossing a threshold
- Alerts when quality or cost drifts from the baseline
- RAG help, meaning building or improving retrieval over your operational and product knowledge, and measuring the quality of its answers
- Open-source tooling that runs in your own cloud account, so the data stays with you
Deliverables
- Instrumented application code, or a collector setup, that emits traces for each LLM call and retrieval step
- Dashboards and alert rules for cost, latency, errors and evaluation scores
- An evaluation baseline your team can rerun when prompts, models or retrieval change
- Documentation and a handover session for your engineers
How it starts
We start with a short scoping call about your LLM application, what you can already measure and where answers go wrong. We then agree which calls to trace first.
How it relates to the audit
The audit looks at your current signals and alerts and can include an AI readiness check. Its findings show whether your existing stack can take AI traces or needs work first.
Start with this serviceAWS Platform Engineering
The work is done by senior engineers, directly with your team.
Who it is for
- Teams that run on AWS and need their environments, pipelines and automation in order
- Teams that want repeatable environments instead of manual changes
What is included
- Environments on AWS defined as code
- CI/CD pipelines for build, test and deploy
- Automation of repeated operational work
- Monitoring and alerting wired in from the start
Deliverables
- Infrastructure code in your repositories
- Working pipelines and runbooks
- A handover session with your team
How it starts
We start with a short scoping call about your current AWS setup and what you want to change.
How it relates to the audit
The audit shows where monitoring and operations are weakest. That often decides which platform work comes first.
Start with this serviceOngoing Support
You deal with the same engineers who built the stack.
Who it is for
- Teams that have an observability stack or AWS platform and want an expert on call for it
- Teams without the capacity to maintain it in-house
What is included
- Maintenance and upgrades of the observability stack
- Review and tuning of dashboards and alerts
- Help with incidents and questions from your engineers
- Cost reviews of your observability and AWS usage
Deliverables
- Regular updates on the state of your stack
- Changes delivered through your repositories and pipelines
How it starts
We agree what is covered and how you reach us. Support usually begins after an implementation or platform project.
How it relates to the audit
Ongoing Support follows the audit and implementation. The audit sets the baseline, and support keeps the stack at that standard.
Start with this service